
Vizro
OfficialCreates interactive data visualization dashboards through natural language by generating chart code and validating Vizro configurations. Provides PyCafe preview links for immediate visualization testing.
Enables creation and validation of data visualization dashboards through natural language by generating chart code, validating configurations, and producing interactive Vizro visualizations with PyCafe preview links.
What it does
- Generate chart code from natural language descriptions
- Validate dashboard configurations and chart code
- Load and analyze CSV/JSON data files
- Create interactive Vizro visualizations
- Generate PyCafe preview links for dashboards
- Access sample datasets for testing
Best for
About Vizro
Vizro is an official MCP server published by mckinsey that provides AI assistants with tools and capabilities via the Model Context Protocol. Vizro creates and validates data-visualization dashboards from natural language, auto-generating chart code and interactive PyCafe previews. It is categorized under analytics data. This server exposes 6 tools that AI clients can invoke during conversations and coding sessions.
How to install
You can install Vizro in your AI client of choice. Use the install panel on this page to get one-click setup for Cursor, Claude Desktop, VS Code, and other MCP-compatible clients. This server runs locally on your machine via the stdio transport.
License
Vizro is released under the Apache-2.0 license. This is a permissive open-source license, meaning you can freely use, modify, and distribute the software.
Tools (6)
Get instructions for creating a Vizro chart or dashboard. Call FIRST when asked to create Vizro things. Must be ALWAYS called FIRST with advanced_mode=False, then call again with advanced_mode=True if the JSON config does not suffice anymore. Returns: Instructions for creating a Vizro chart or dashboard
Get the JSON schema for the specified Vizro model. Server Vizro version: 0.1.50
If user provides no data, use this tool to get sample data information. Use the following data for the below purposes: - iris: mostly numerical with one categorical column, good for scatter, histogram, boxplot, etc. - tips: contains mix of numerical and categorical columns, good for bar, pie, etc. - stocks: stock prices, good for line, scatter, generally things that change over time - gapminder: demographic data, good for line, scatter, generally things with maps or many categories Returns: Data info object containing information about the dataset.
Use to understand local or remote data files. Must be called with absolute paths or URLs. Supported formats: - CSV (.csv) - JSON (.json) - HTML (.html, .htm) - Excel (.xls, .xlsx) - OpenDocument Spreadsheet (.ods) - Parquet (.parquet) Returns: DataAnalysisResults object containing DataFrame information and metadata
Validate Vizro model configuration. Run ALWAYS when you have a complete dashboard configuration. If successful, the tool will return the python code and, if it is a remote file, the py.cafe link to the chart. The PyCafe link will be automatically opened in your default browser if auto_open is True. Returns: ValidationResults object with status and dashboard details

Vizro is a low-code toolkit for building high-quality data visualization apps
![]()
![]()
![]()
What is Vizro?
Vizro is an open-source Python-based toolkit.
Use it to build beautiful and powerful data visualization apps quickly and easily, without needing advanced engineering or visual design expertise.
Then customize and deploy your app to production at scale.
In just a few lines of simple low-code configuration, with in-built visual design best practices, you can quickly assemble high-quality, multi-page prototypes, that are production-ready.
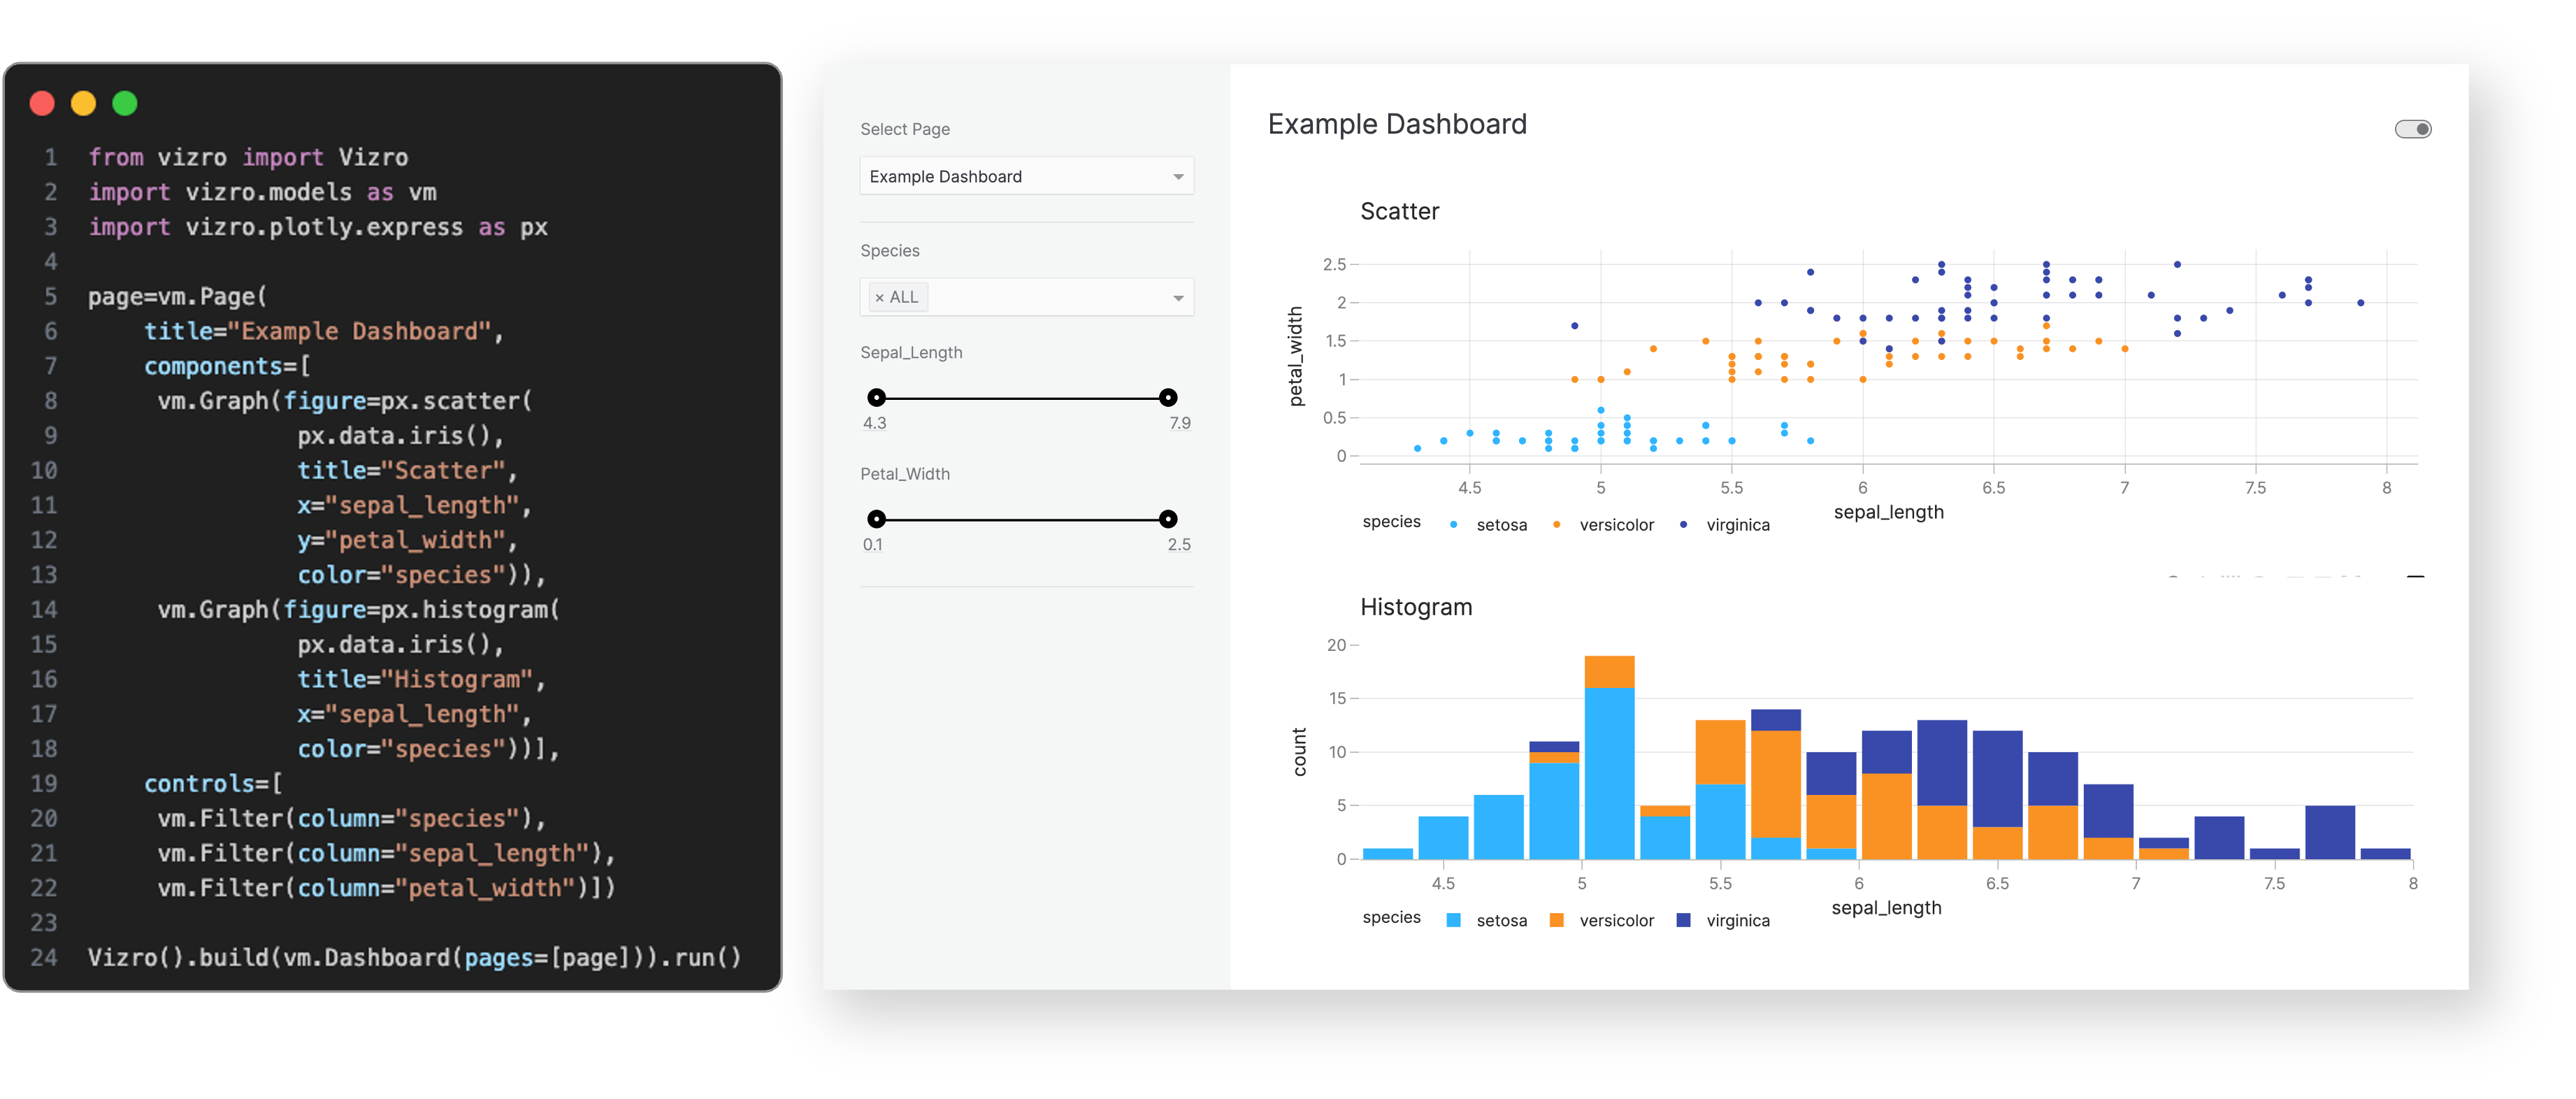
Every Vizro app is defined by a simple configuration, using these high-level categories:
- Components: charts, tables, cards, KPI indicators, forms and more.
- Controls: filters and parameters, using a range of selectors such as drop-down menus and sliders.
- Actions: interactions between components, drill-throughs, export functionality and more.
- Layouts: grid layouts or flexible containers, with a range of pre-set styles.
- Navigation: a range of app layout and navigation settings, including nested page hierarchies.
Configuration can be written in multiple formats including Pydantic models, JSON, YAML or Python dictionaries for added flexibility of implementation.
Optional high-code extensions enable almost infinite customization in a modular way, combining the best of low-code and high-code - including bespoke visual formatting and custom components.
Visit our "How-to guides" for a more detailed explanation of Vizro features.
Why use Vizro?
The benefits of the Vizro toolkit include:

Vizro helps you to build data visualization apps that are:
Quick and easy
Build apps in minutes. Use a few lines of simple configuration (via Pydantic models, JSON, YAML, or Python dictionaries) in place of thousands of lines of code.
Beautiful and powerful
Build high-quality multi-page apps without needing advanced engineering or visual design expertise. Use powerful features of production-grade BI tools, with in-built visual design best practices.
Flexible
Benefit from the capabilities and flexibility of open-source packages. Use the trusted dependencies of Plotly, Dash, and Pydantic.
Customizable
Almost infinite control for advanced users. Use Python, JavaScript, HTML and CSS code extensions.
Scalable
Rapidly prototype and deploy to production. Use the in-built production-grade capabilities of Plotly, Dash and Pydantic.
Visit "Why should I use Vizro?" for a more detailed explanation of Vizro use cases.
When to use Vizro?
Use Vizro when you need to combine the speed and ease of low-code Python tools, with production capabilities of JavaScript and BI tools, and the freedom of open source:
- Have an app that looks beautiful and professional by default.
- Enjoy the simplicity of low-code, plus the option to customize with code almost infinitely.
- Rapidly create prototypes which are production-ready and easy to deploy at scale.
How to use Vizro?
Vizro framework
Low-code framework for building dashboards.
The Vizro framework underpins the entire Vizro toolkit. It is a Python package (called vizro).
Visit the documentation for more details.
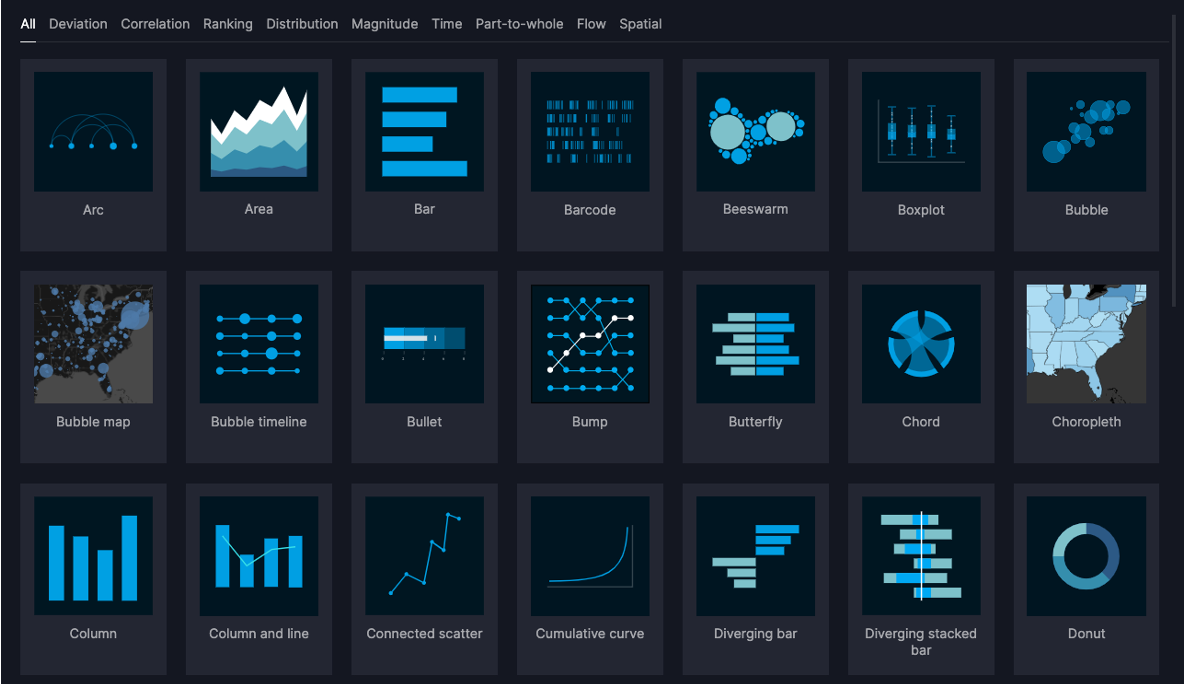
Vizro visual vocabulary
Chart examples.
The visual vocabulary helps you to decide which chart type to use for your requirements, and offers sample code to create these charts with Plotly or embed them into a Vizro dashboard.
Visit the visual vocabulary to search for charts or get inspiration.
 Link to vizro-demo-visual-vocabulary.hf.space
Vizro-MCP
A Model Context Protocol (MCP) server for Vizro.
Vizro-MCP works alongside an LLM to help you create Vizro dashboards and charts. It provides tools and templates to create a functioning Vizro chart or dashboard step-by-step.
Compatible with MCP-enabled LLM clients such as Cursor or Claude Desktop.

Vizro-AI
Use LLMs to generate charts and dashboards.
Vizro-AI dashboard generation is no longer actively developed and is superseded by Vizro-MCP. Vizro-AI supports only chart generation from version 0.4.0.
Vizro-AI is a separate package (called vizro_ai) that extends Vizro to incorporate LLMs. Use it to build interactive Vizro charts and dashboards, by simply describing what you need in plain English or other languages.
Visit the Vizro-AI documentation for more details.

Installation and first steps
pip install vizro
See the installation guide for more information.
The get started documentation explains how to create your first dashboard.
Packages
This repository is a monorepo containing the following packages:
| Folder | Version | Documentation |
|---|---|---|
| vizro-core | Vizro Docs | |
| vizro-ai | Vizro-AI Docs | |
| vizro-mcp | Vizro-MCP Docs |
Community and development
We encourage you to ask and discuss any technical questions via the GitHub Issues. This is also the place where you can submit bug reports or request new features.
Want to contribute to Vizro?
The contributing guide explains how you can contribute to Vizro.
You can also view current and former contributors here.
Want to report a se
README truncated. View full README on GitHub.
Alternatives
Related Skills
Browse all skillsTransform data into compelling narratives using visualization, context, and persuasive structure. Use when presenting analytics to stakeholders, creating data reports, or building executive presentations.
Analyze Google Analytics data, review website performance metrics, identify traffic patterns, and suggest data-driven improvements. Use when the user asks about analytics, website metrics, traffic analysis, conversion rates, user behavior, or performance optimization.
Advanced content and topic research skill that analyzes trends across Google Analytics, Google Trends, Substack, Medium, Reddit, LinkedIn, X, blogs, podcasts, and YouTube to generate data-driven article outlines based on user intent analysis
Expert data scientist for advanced analytics, machine learning, and statistical modeling. Handles complex data analysis, predictive modeling, and business intelligence. Use PROACTIVELY for data analysis tasks, ML modeling, statistical analysis, and data-driven insights.
YouTube Data API v3 analytics toolkit. Analyze YouTube channels, videos, and search results. Use when the user asks to: check YouTube channel stats, analyze video performance, compare channels, search for videos, get subscriber counts, view engagement metrics, find trending videos, get channel uploads, or analyze YouTube competition. Requires a YouTube Data API v3 key from Google Cloud Console.
Comprehensive backend development guide for Langfuse's Next.js 14/tRPC/Express/TypeScript monorepo. Use when creating tRPC routers, public API endpoints, BullMQ queue processors, services, or working with tRPC procedures, Next.js API routes, Prisma database access, ClickHouse analytics queries, Redis queues, OpenTelemetry instrumentation, Zod v4 validation, env.mjs configuration, tenant isolation patterns, or async patterns. Covers layered architecture (tRPC procedures → services, queue processors → services), dual database system (PostgreSQL + ClickHouse), projectId filtering for multi-tenant isolation, traceException error handling, observability patterns, and testing strategies (Jest for web, vitest for worker).