
Optuna
OfficialAutomates hyperparameter tuning and optimization using the Optuna framework. Lets AI assistants optimize model parameters and analyze results through interactive visualizations.
Provides automated hyperparameter optimization and analysis using Optuna framework with support for multiple samplers, multi-objective optimization, parameter importance analysis, and interactive visualizations including optimization history and Pareto fronts.
What it does
- Run hyperparameter optimization studies
- Generate optimization history plots
- Analyze parameter importance
- Create Pareto front visualizations
- Support multiple sampling algorithms
- Perform multi-objective optimization
Best for
About Optuna
Optuna is an official MCP server published by optuna that provides AI assistants with tools and capabilities via the Model Context Protocol. Optimize hyper parameters effortlessly with Optuna, the best AutoML software for automated analysis, visualization, and multi-objective optimization. It is categorized under ai ml, analytics data.
How to install
You can install Optuna in your AI client of choice. Use the install panel on this page to get one-click setup for Cursor, Claude Desktop, VS Code, and other MCP-compatible clients. This server runs locally on your machine via the stdio transport.
License
Optuna is released under the MIT license. This is a permissive open-source license, meaning you can freely use, modify, and distribute the software.
Optuna MCP Server

![]()
![]()
A Model Context Protocol (MCP) server that automates optimization and analysis using Optuna.
Use Cases
The Optuna MCP Server can be used in the following use cases, for example.
- Automated hyperparameter optimization by LLMs
- Interactive analysis of Optuna's optimization results via chat interface
- Optimize input and output of other MCP tools
For details, see the Examples section.
Installation
The Optuna MCP server can be installed using uv or Docker.
This section explains how to install the Optuna MCP server, using Claude Desktop as an example MCP client.
Usage with uv
Before starting the installation process, install uv from Astral.
Then, add the Optuna MCP server configuration to the MCP client.
To include it in Claude Desktop, go to Claude > Settings > Developer > Edit Config > claude_desktop_config.json
and add the following:
{
  "mcpServers": {
    "Optuna": {
      "command": "/path/to/uvx",
      "args": [
        "optuna-mcp"
      ]
    }
  }
}
Additionally, you can specify the Optuna storage with the --storage argument to persist the results.
{
  "mcpServers": {
    "Optuna": {
      "command": "/path/to/uvx",
      "args": [
        "optuna-mcp",
        "--storage",
        "sqlite:///optuna.db"
      ]
    }
  }
}
After adding this, please restart Claude Desktop application. For more information about Claude Desktop, check out the quickstart page.
Usage with Docker
You can also run the Optuna MCP server using Docker. Make sure you have Docker installed and running on your machine.
{
  "mcpServers": {
    "Optuna": {
      "command": "docker",
      "args": [
        "run",
        "-i",
        "--rm",
        "--net=host",
        "-v",
        "/PATH/TO/LOCAL/DIRECTORY/WHICH/INCLUDES/DB/FILE:/app/workspace",
        "optuna/optuna-mcp:latest",
        "--storage",
        "sqlite:////app/workspace/optuna.db"
      ]
    }
  }
}
Tools provided by Optuna MCP
The Optuna MCP provides the following tools. Specifically, it offers primitive functions of Optuna such as Study, Trial, Visualization, and Dashboard. Since MCP clients know the list of tools and the details of each tool, users do not need to remember those details.
Study
- create_study - Create a new Optuna study with the given study_name and directions.
If the study already exists, it will be simply loaded.
study_name: name of the study (string, required).directions: The directions of optimization (list of literal strings minimize/maximize, optional).
- set_sampler - Set the sampler for the study.
name: the name of the sampler (string, required).
- get_all_study_names - Get all study names from the storage.
- set_metric_names - Set metric_names. Metric_names are labels used to distinguish what each objective value is.
metric_names: The list of metric names for each objective (list of strings, required).
- get_metric_names - Get metric_names.
- No parameters required.
- get_directions - Get the directions of the study.
- No parameters required.
- get_trials - Get all trials in a CSV format.
- No parameters required.
- best_trial - Get the best trial.
- No parameters required.
- best_trials - Return trials located at the Pareto front in the study.
- No parameters required.
Trial
- ask - Suggest new parameters using Optuna.
search_space: the search space for Optuna (dictionary, required).
- tell - Report the result of a trial.
trial_number: the trial number (integer, required).values: the result of the trial (float or list of floats, required).
- set_trial_user_attr - Set user attributes for a trial.
trial_number: the trial number (integer, required).key: the key of the user attribute (string, required).value: the value of the user attribute (any type, required).
- get_trial_user_attrs - Get user attributes in a trial.
trial_number: the trial number (integer, required).
Visualization
- plot_optimization_history - Return the optimization history plot as an image.
target: index to specify which value to display (integer, optional).target_name: target’s name to display on the axis label (string, optional).
- plot_hypervolume_history - Return the hypervolume history plot as an image.
reference_point: a list of reference points to calculate the hypervolume (list of floats, required).
- plot_pareto_front - Return the Pareto front plot as an image for multi-objective optimization.
target_names: objective name list used as the axis titles (list of strings, optional).include_dominated_trials: a flag to include all dominated trial's objective values (boolean, optional).targets: a list of indices to specify the objective values to display. (list of integers, optional).
- plot_contour - Return the contour plot as an image.
params: parameter list to visualize (list of strings, optional).target: an index to specify the value to display (integer, required).target_name: target’s name to display on the color bar (string, required).
- plot_parallel_coordinate - Return the parallel coordinate plot as an image.
params: parameter list to visualize (list of strings, optional).target: an index to specify the value to display (integer, required).target_name: target’s name to display on the axis label and the legend (string, required).
- plot_slice - Return the slice plot as an image.
params: parameter list to visualize (list of strings, optional).target: an index to specify the value to display (integer, required).target_name: target’s name to display on the axis label (string, required).
- plot_param_importances - Return the parameter importances plot as an image.
params: parameter list to visualize (list of strings, optional).target: an index to specify the value to display (integer/null, optional).target_name: target’s name to display on the legend (string, required).
- plot_edf - Return the EDF plot as an image.
target: an index to specify the value to display (integer, required).target_name: target’s name to display on the axis label (string, required).
- plot_timeline - Return the timeline plot as an image.
- No parameters required.
- plot_rank - Return the rank plot as an image.
params: parameter list to visualize (list of strings, optional).target: an index to specify the value to display (integer, required).target_name: target’s name to display on the color bar (string, required).
Web Dashboard
- launch_optuna_dashboard - Launch the Optuna dashboard.
port: server port (integer, optional, default: 58080).
Examples
- Optimizing the 2D-Sphere function
- Starting the Optuna dashboard and analyzing optimization results
- Optimizing the FFmpeg encoding parameters
- Optimizing the Cookie Recipe
- Optimizing the Matplotlib Configuration
Optimizing the 2D-Sphere Function
Here we present a simple example of optimizing the 2D-Sphere function, along with example prompts and the summary of the LLM responses.
| User prompt | Output in Claude |
|---|---|
| (Launch Claude Desktop) | 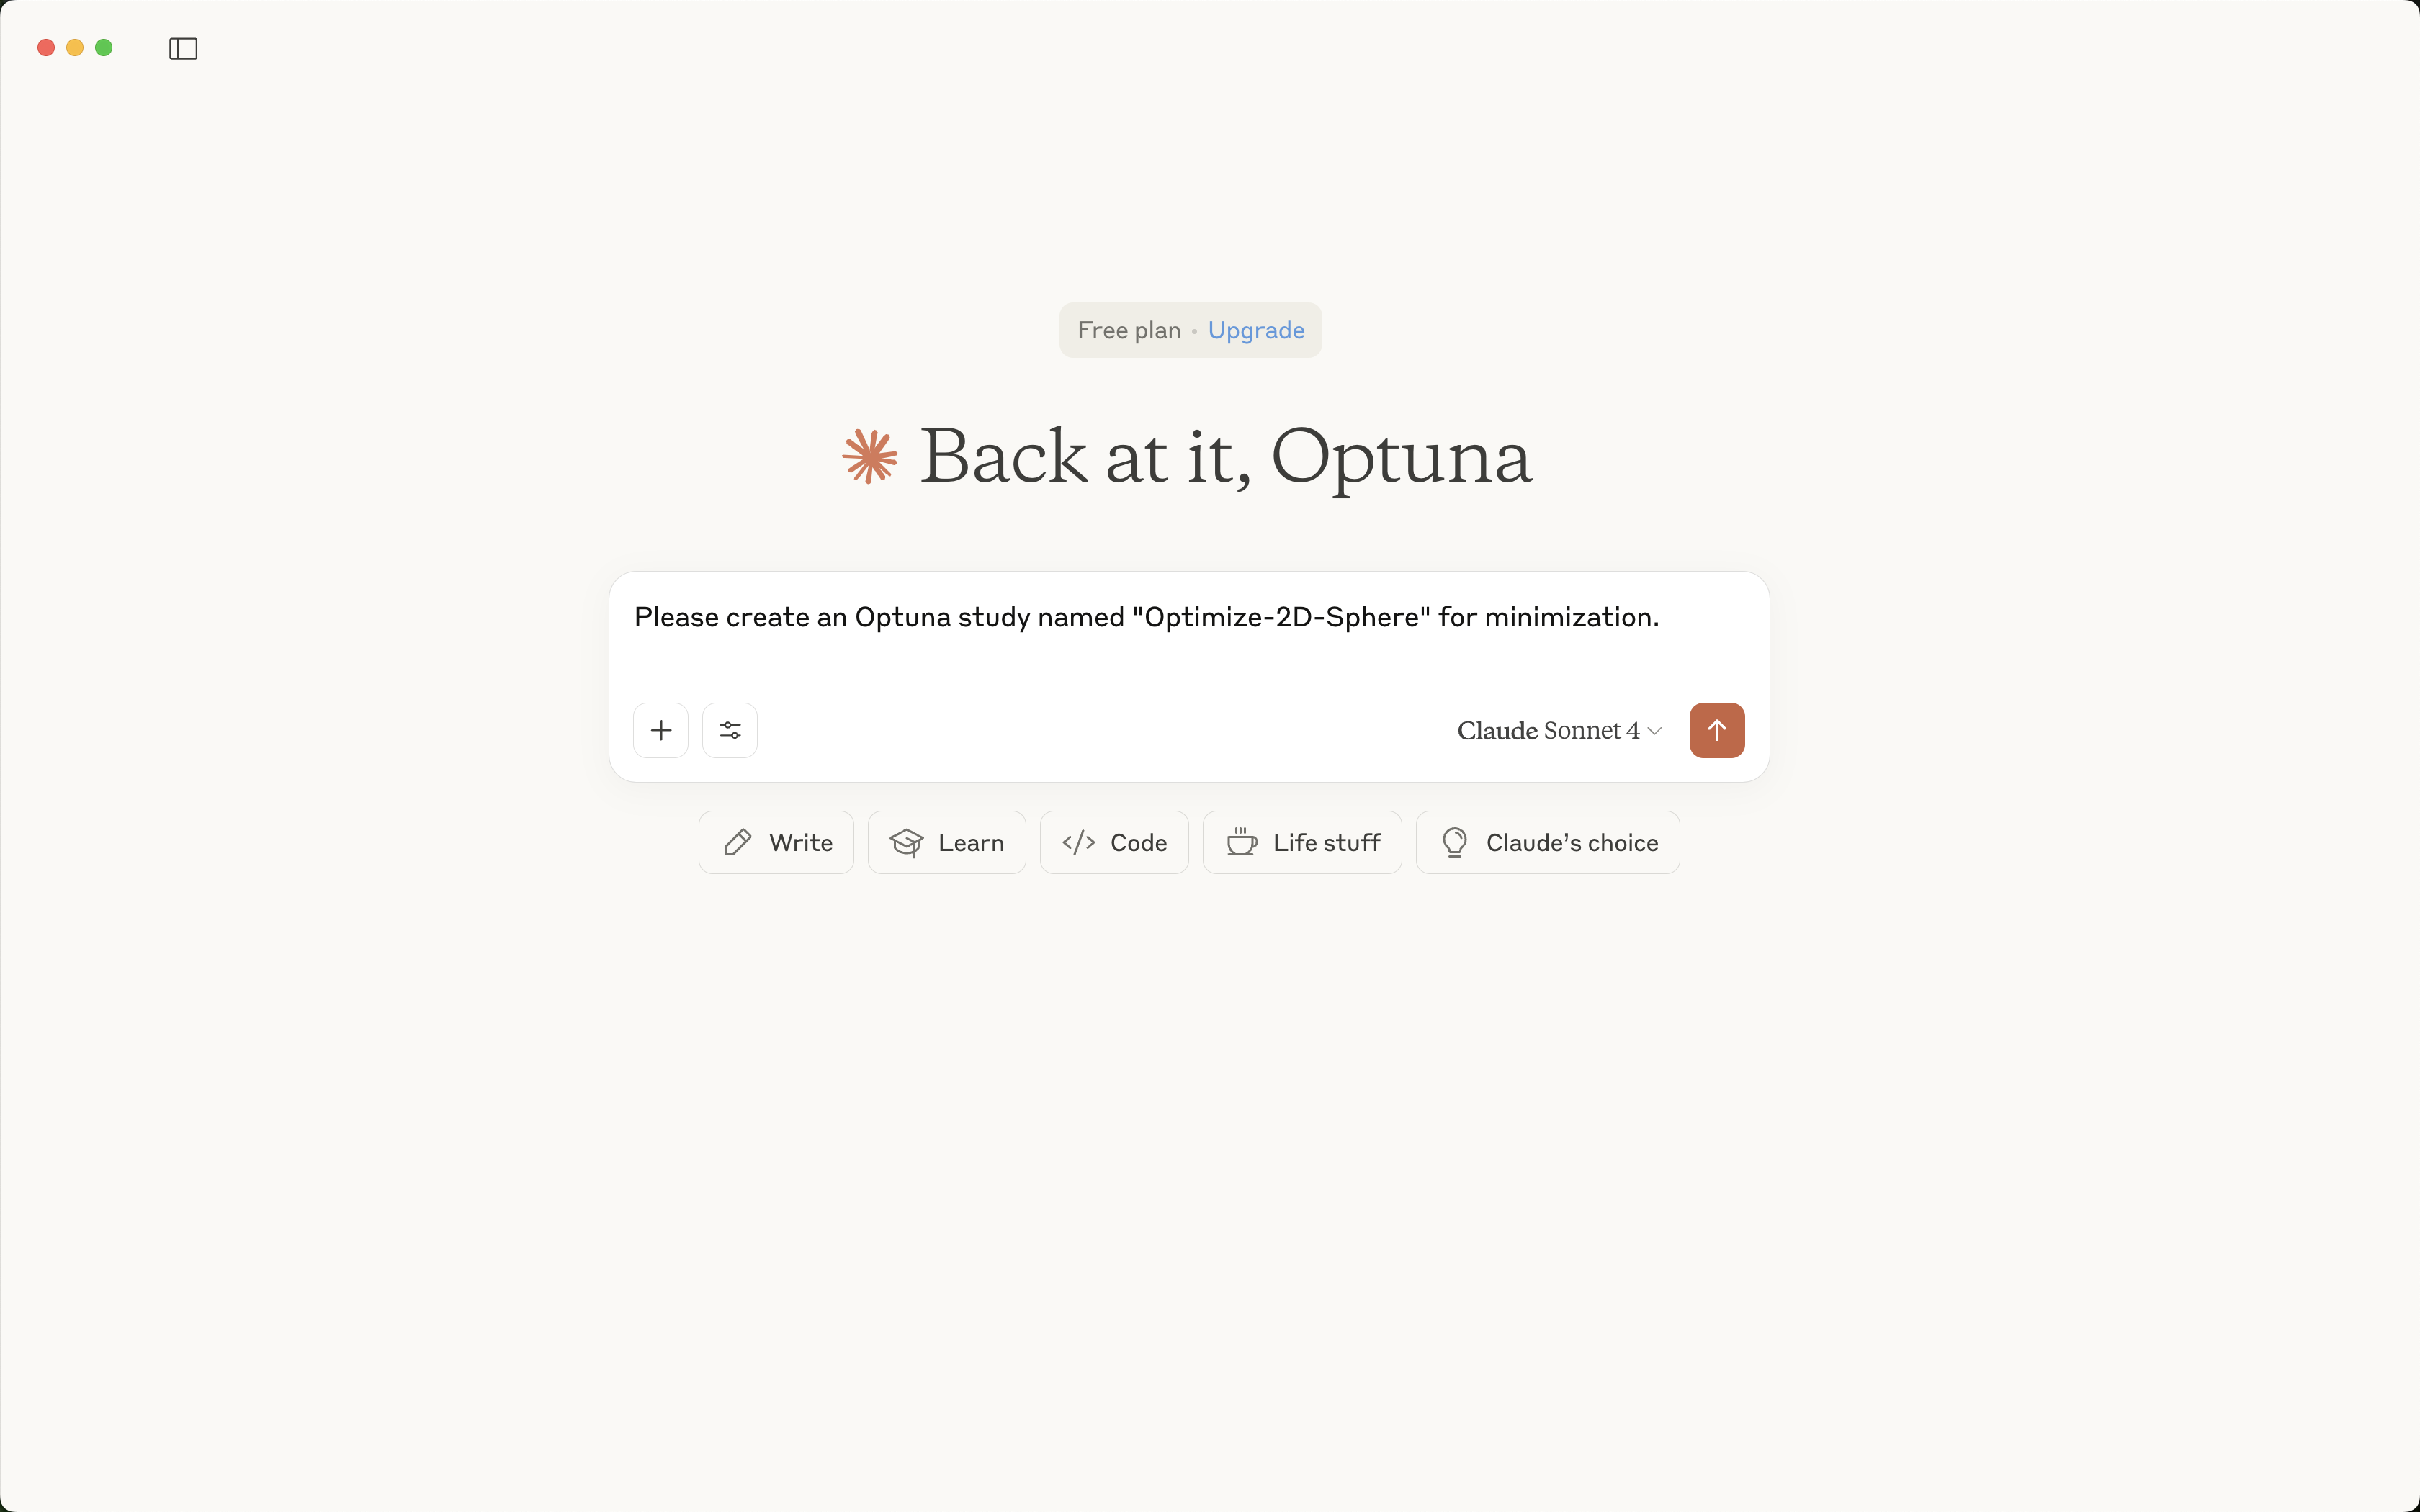 |
| Please create an Optuna study named "Optimize-2D-Sphere" for minimization. | 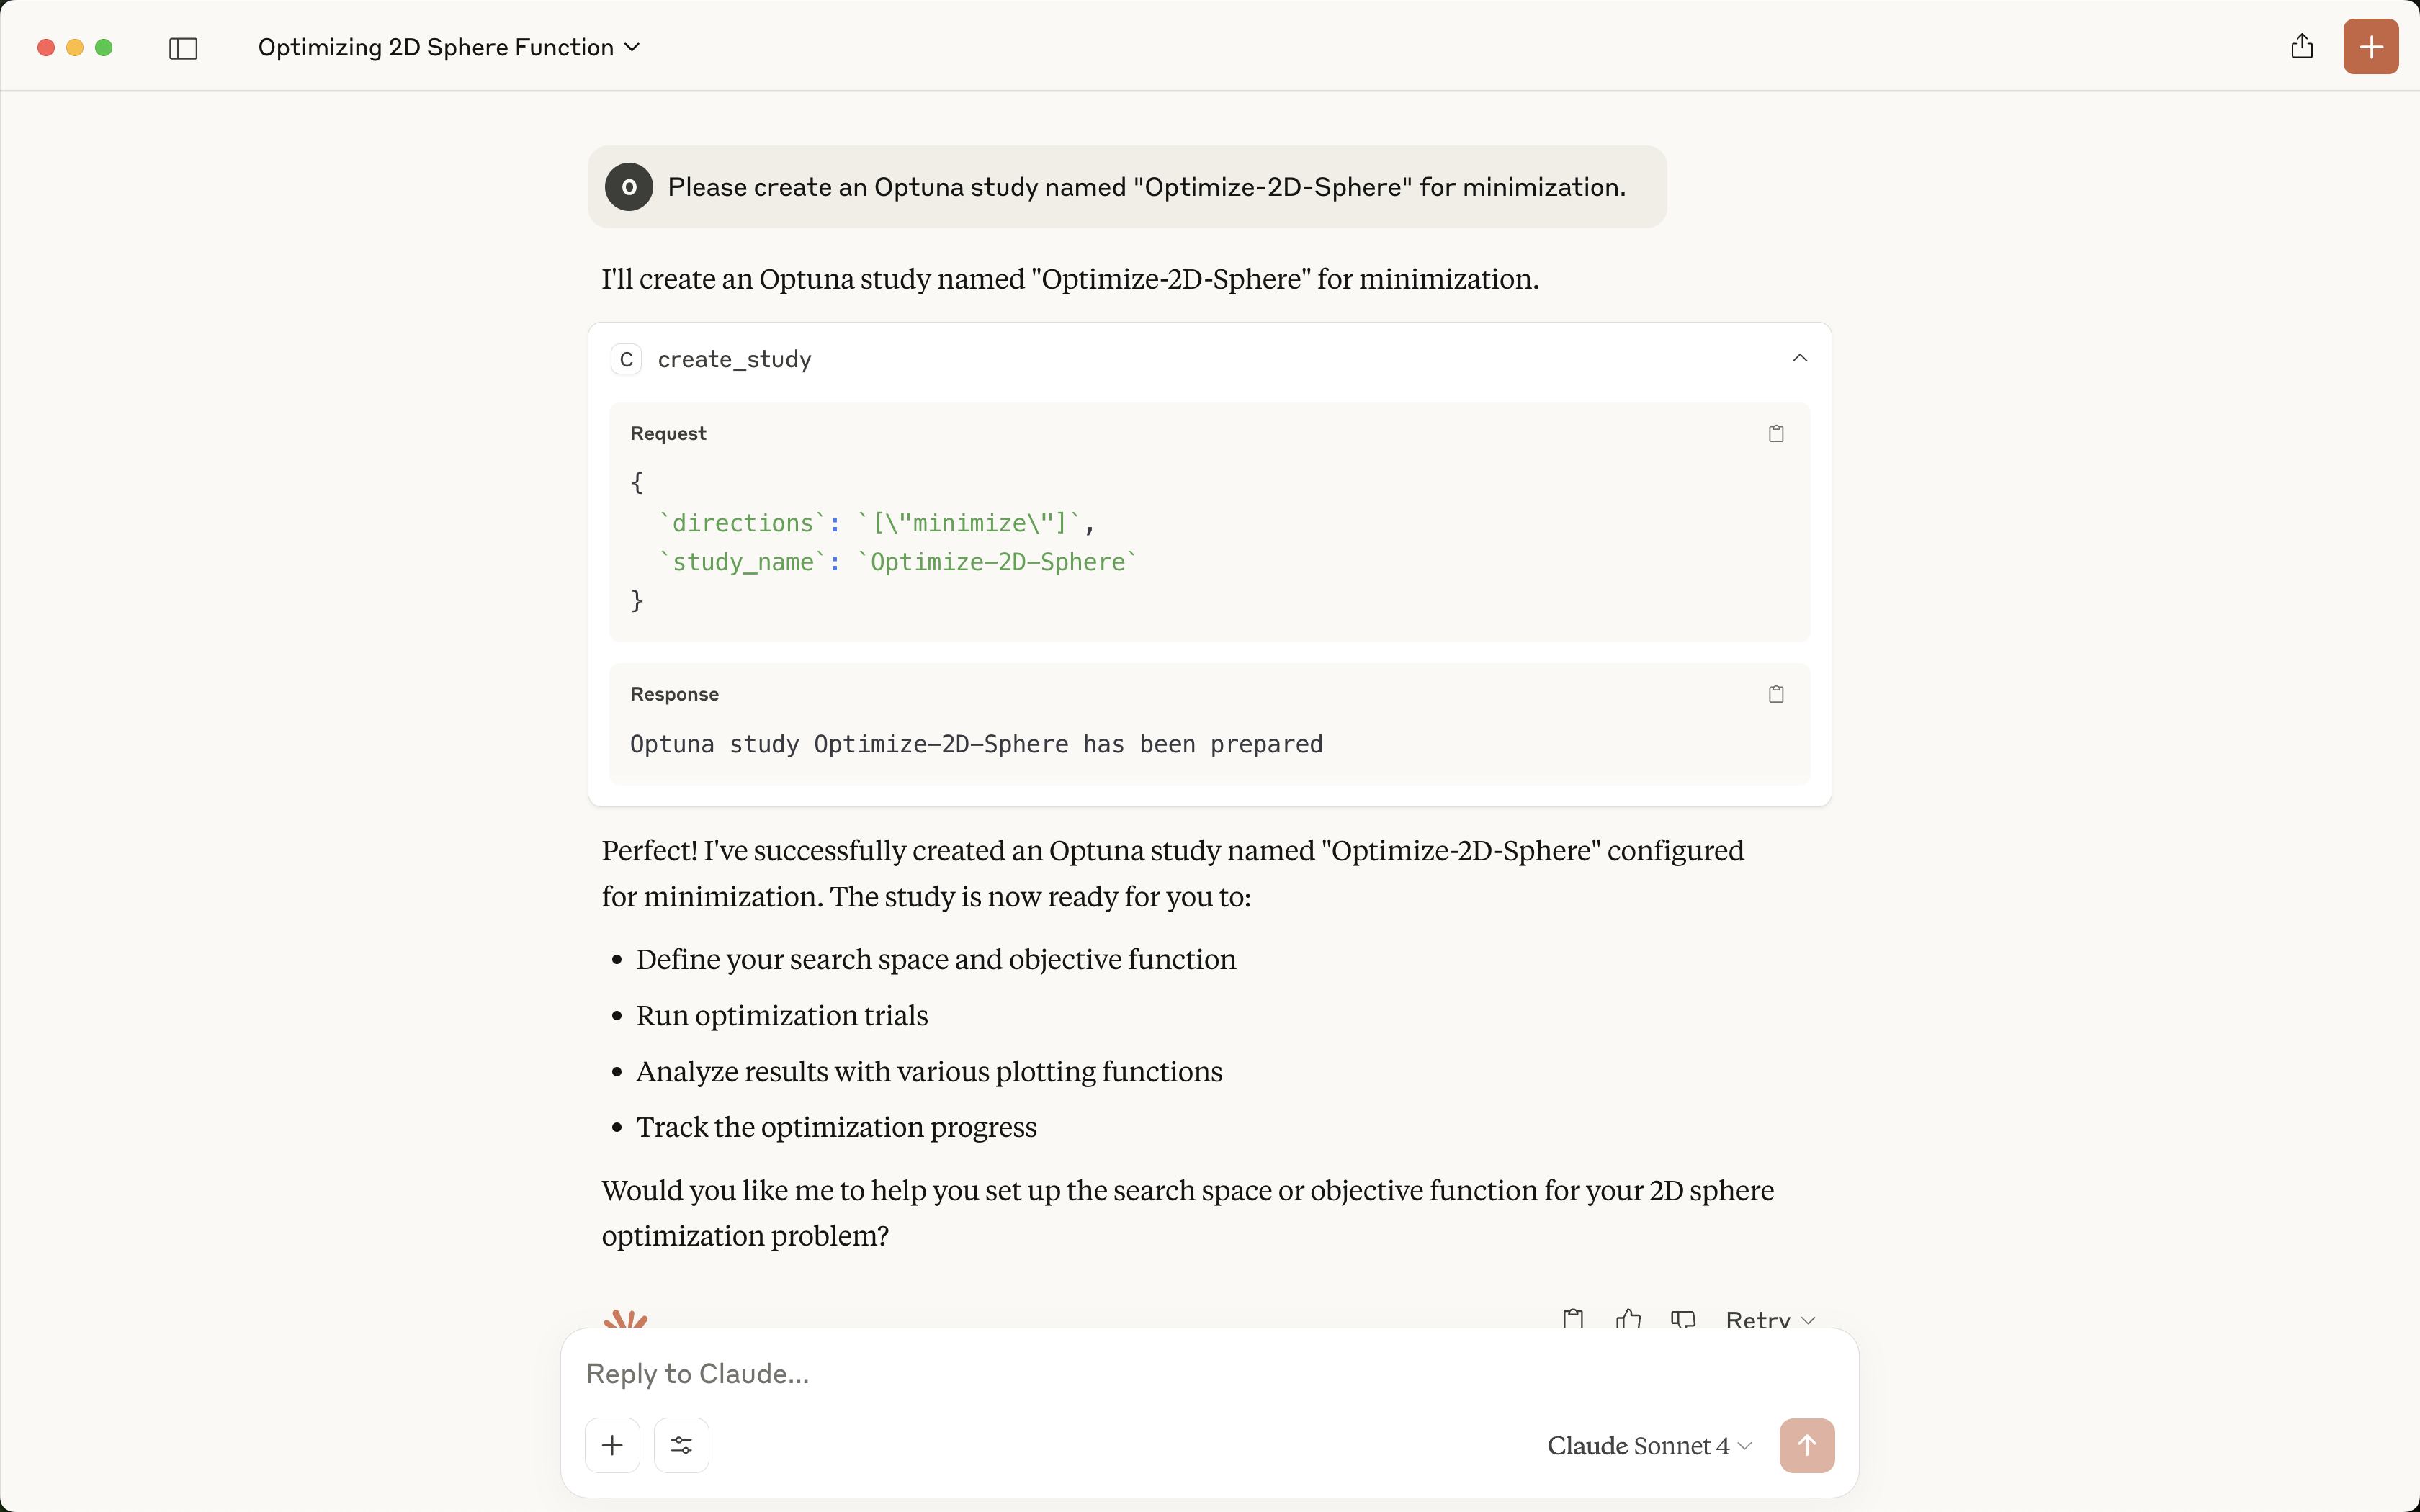 |
| Please suggest two float parameters x, y in [-1, 1]. | 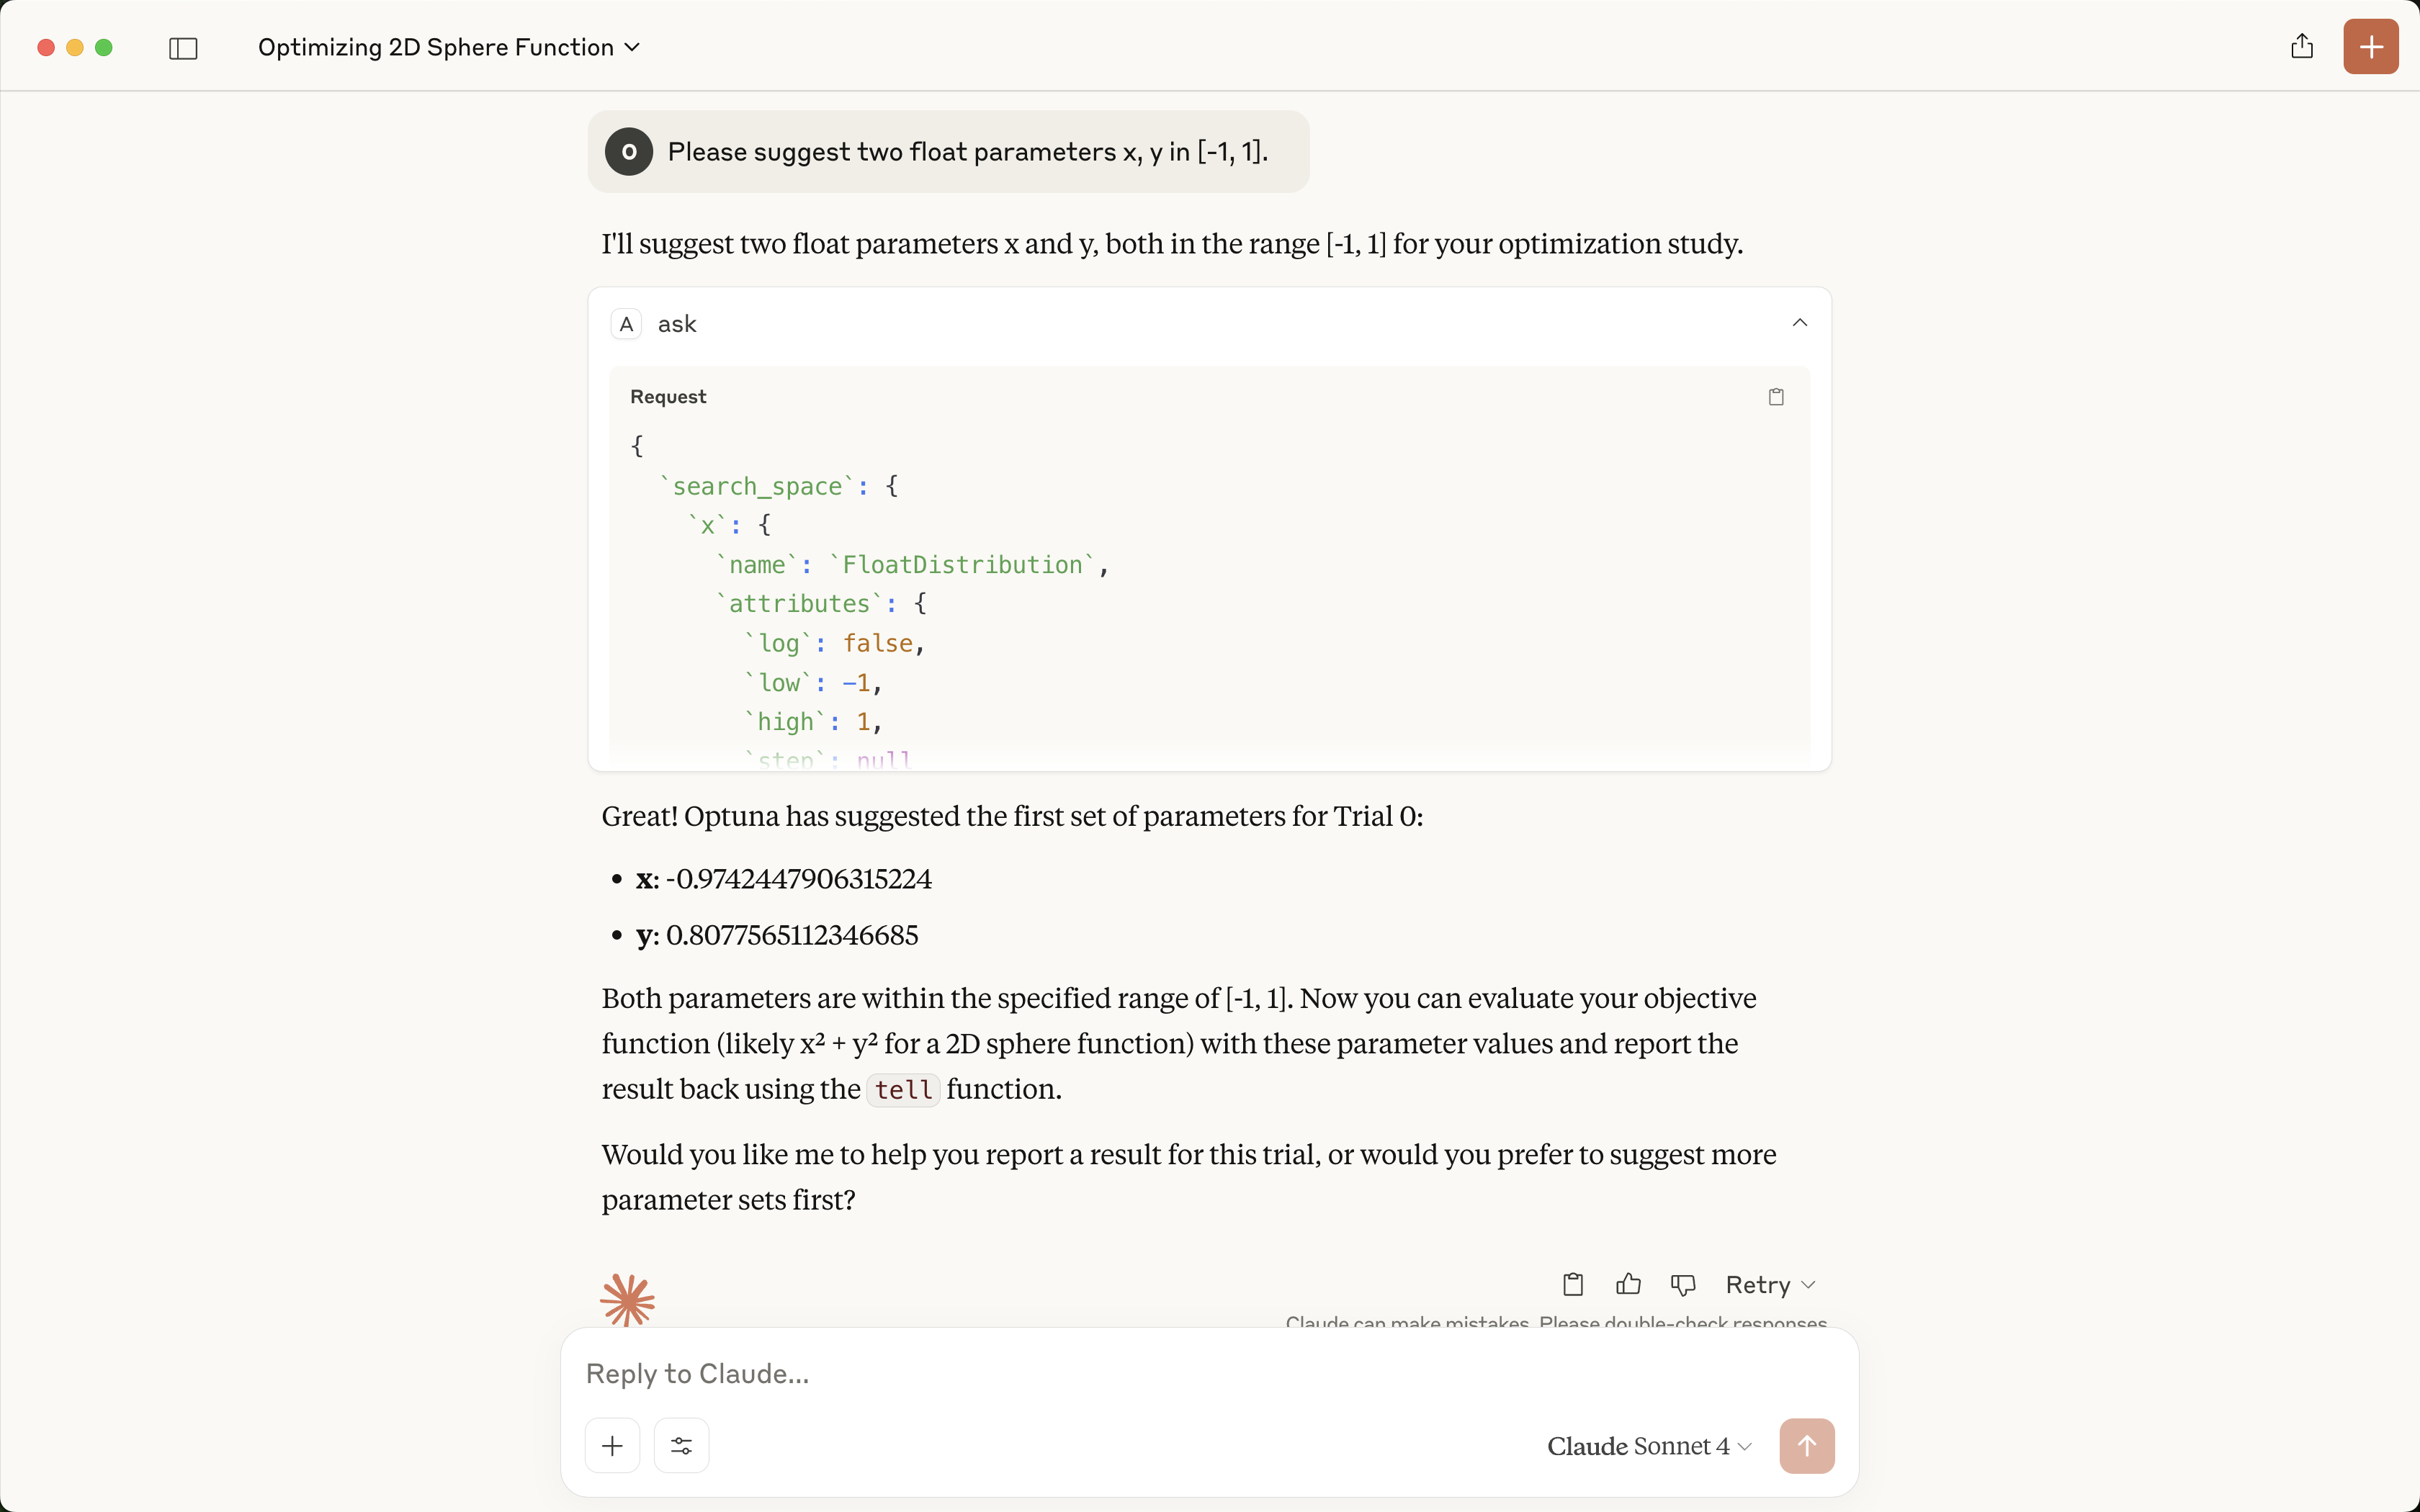 |
| Please report the objective value x**2 + y**2. To calculate the value, please use the JavaScript interpreter and do not round the values. | 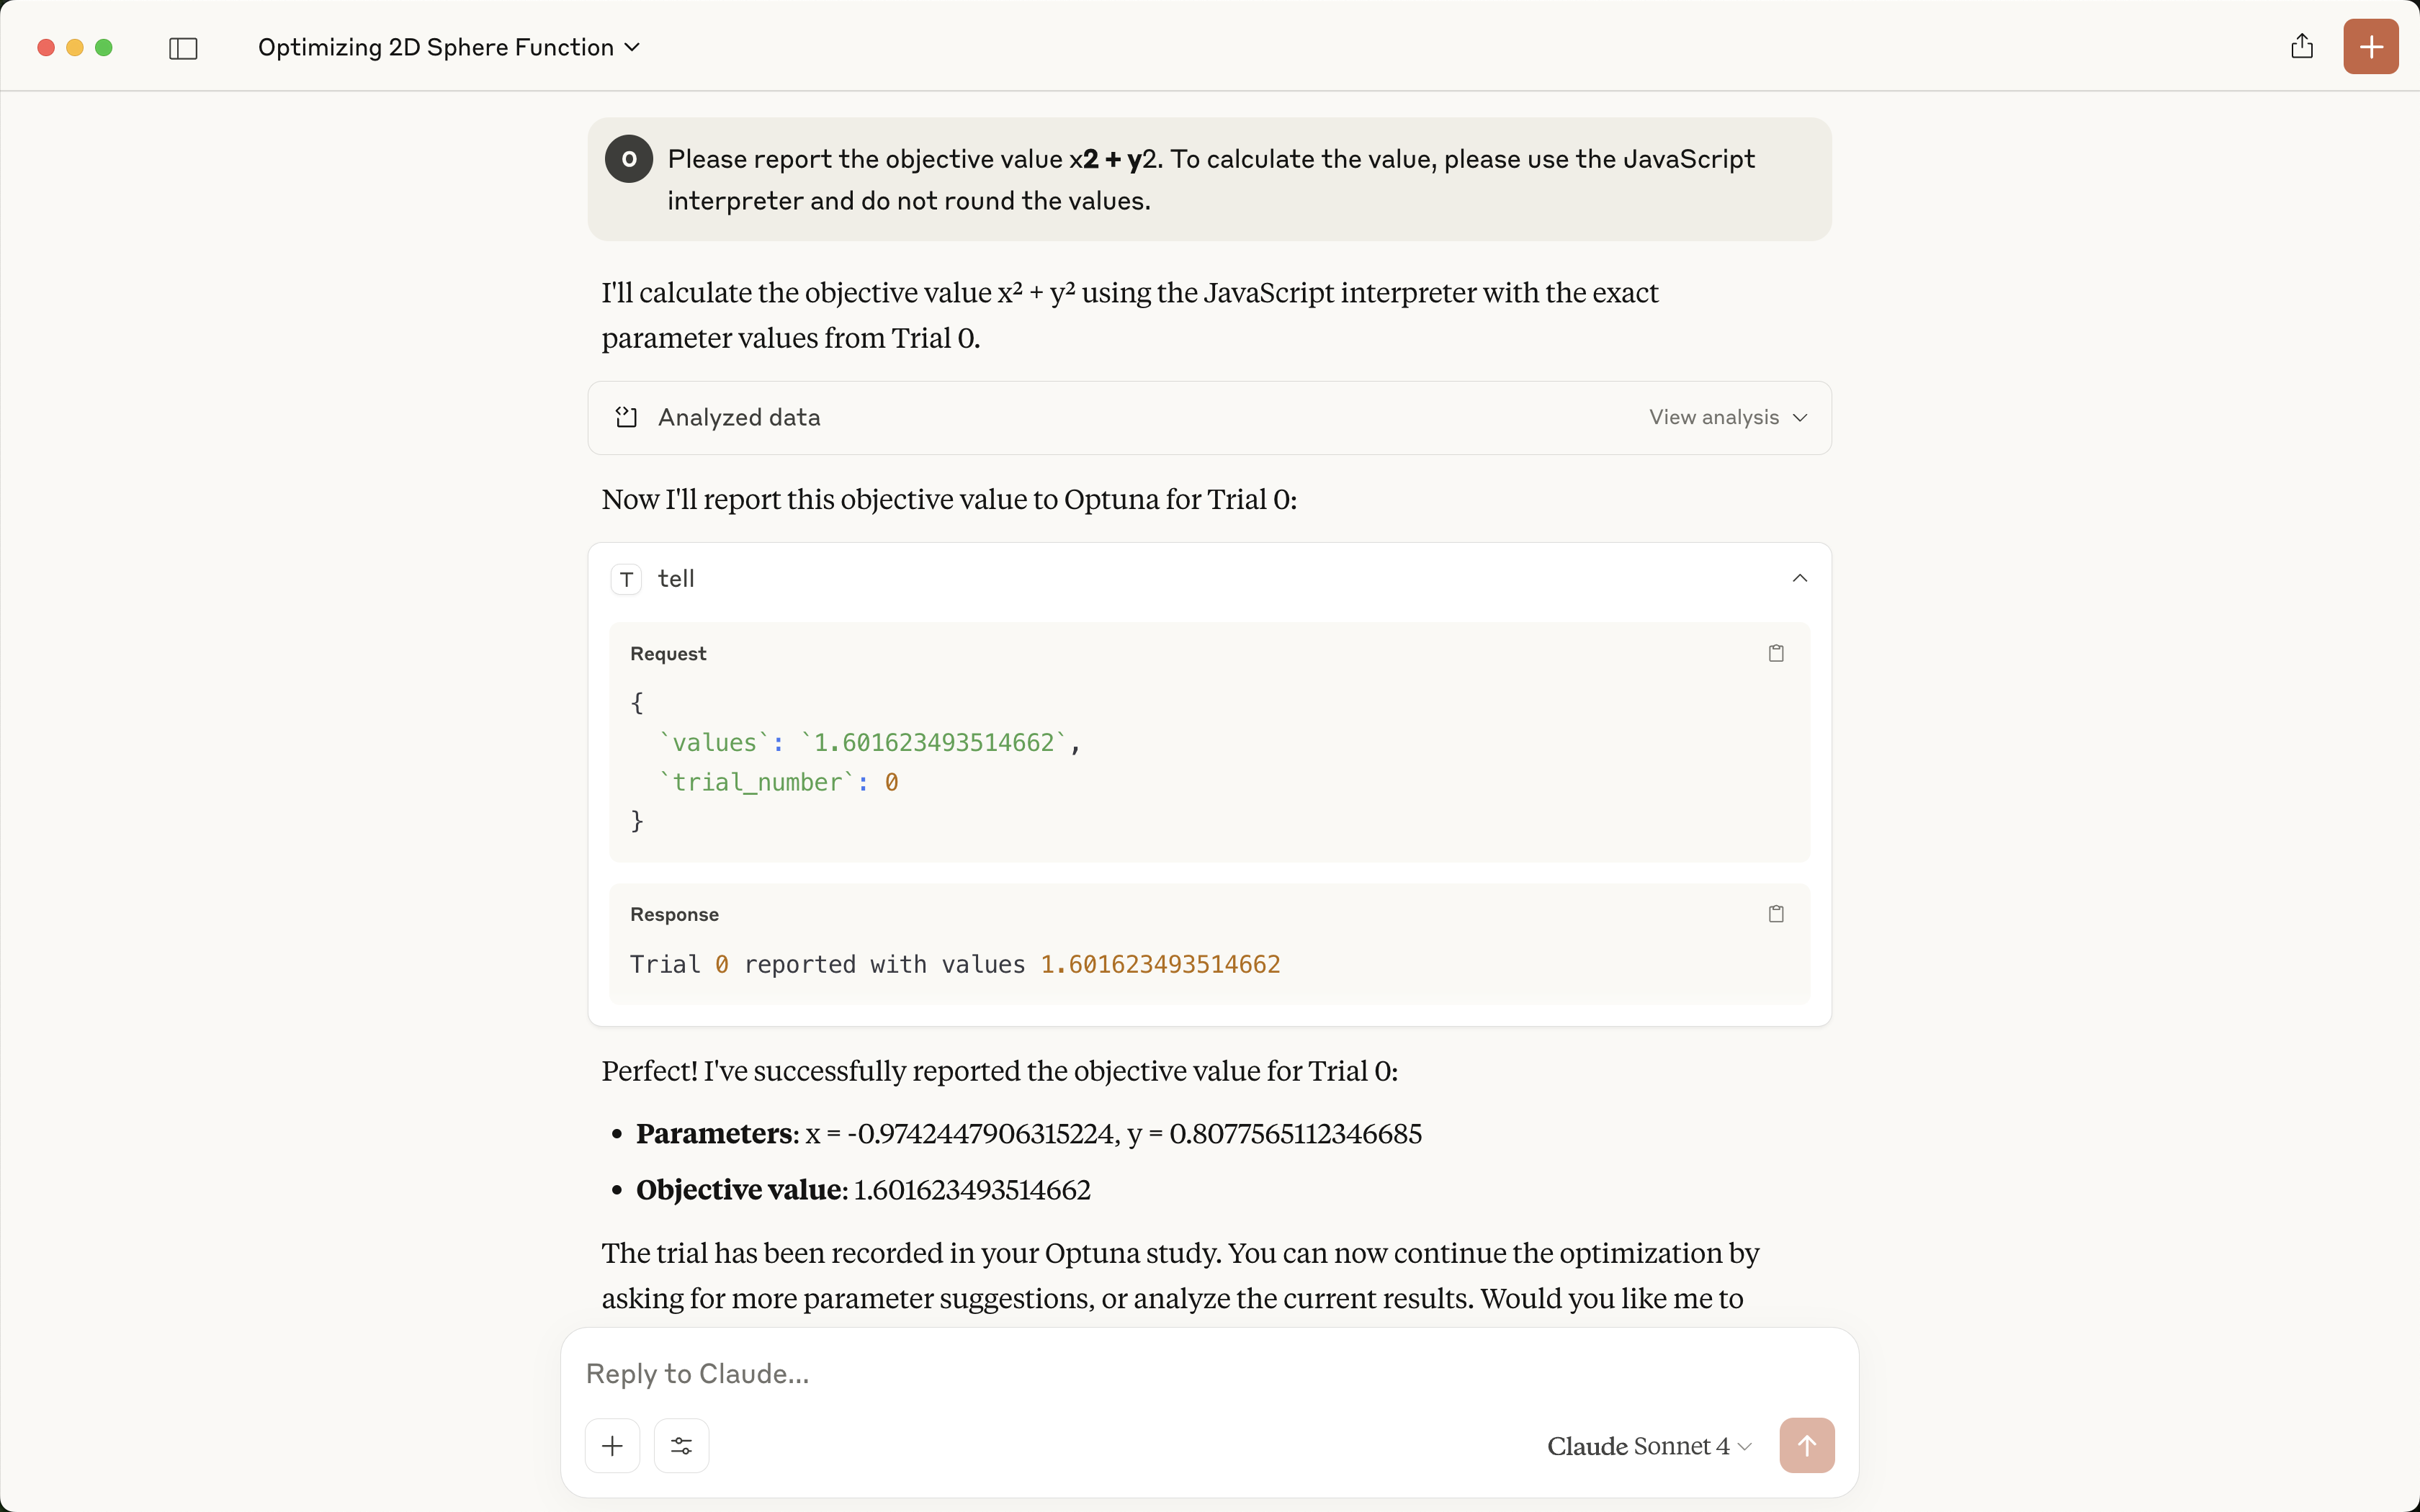 |
| Please suggest another parameter set and evaluate it. | 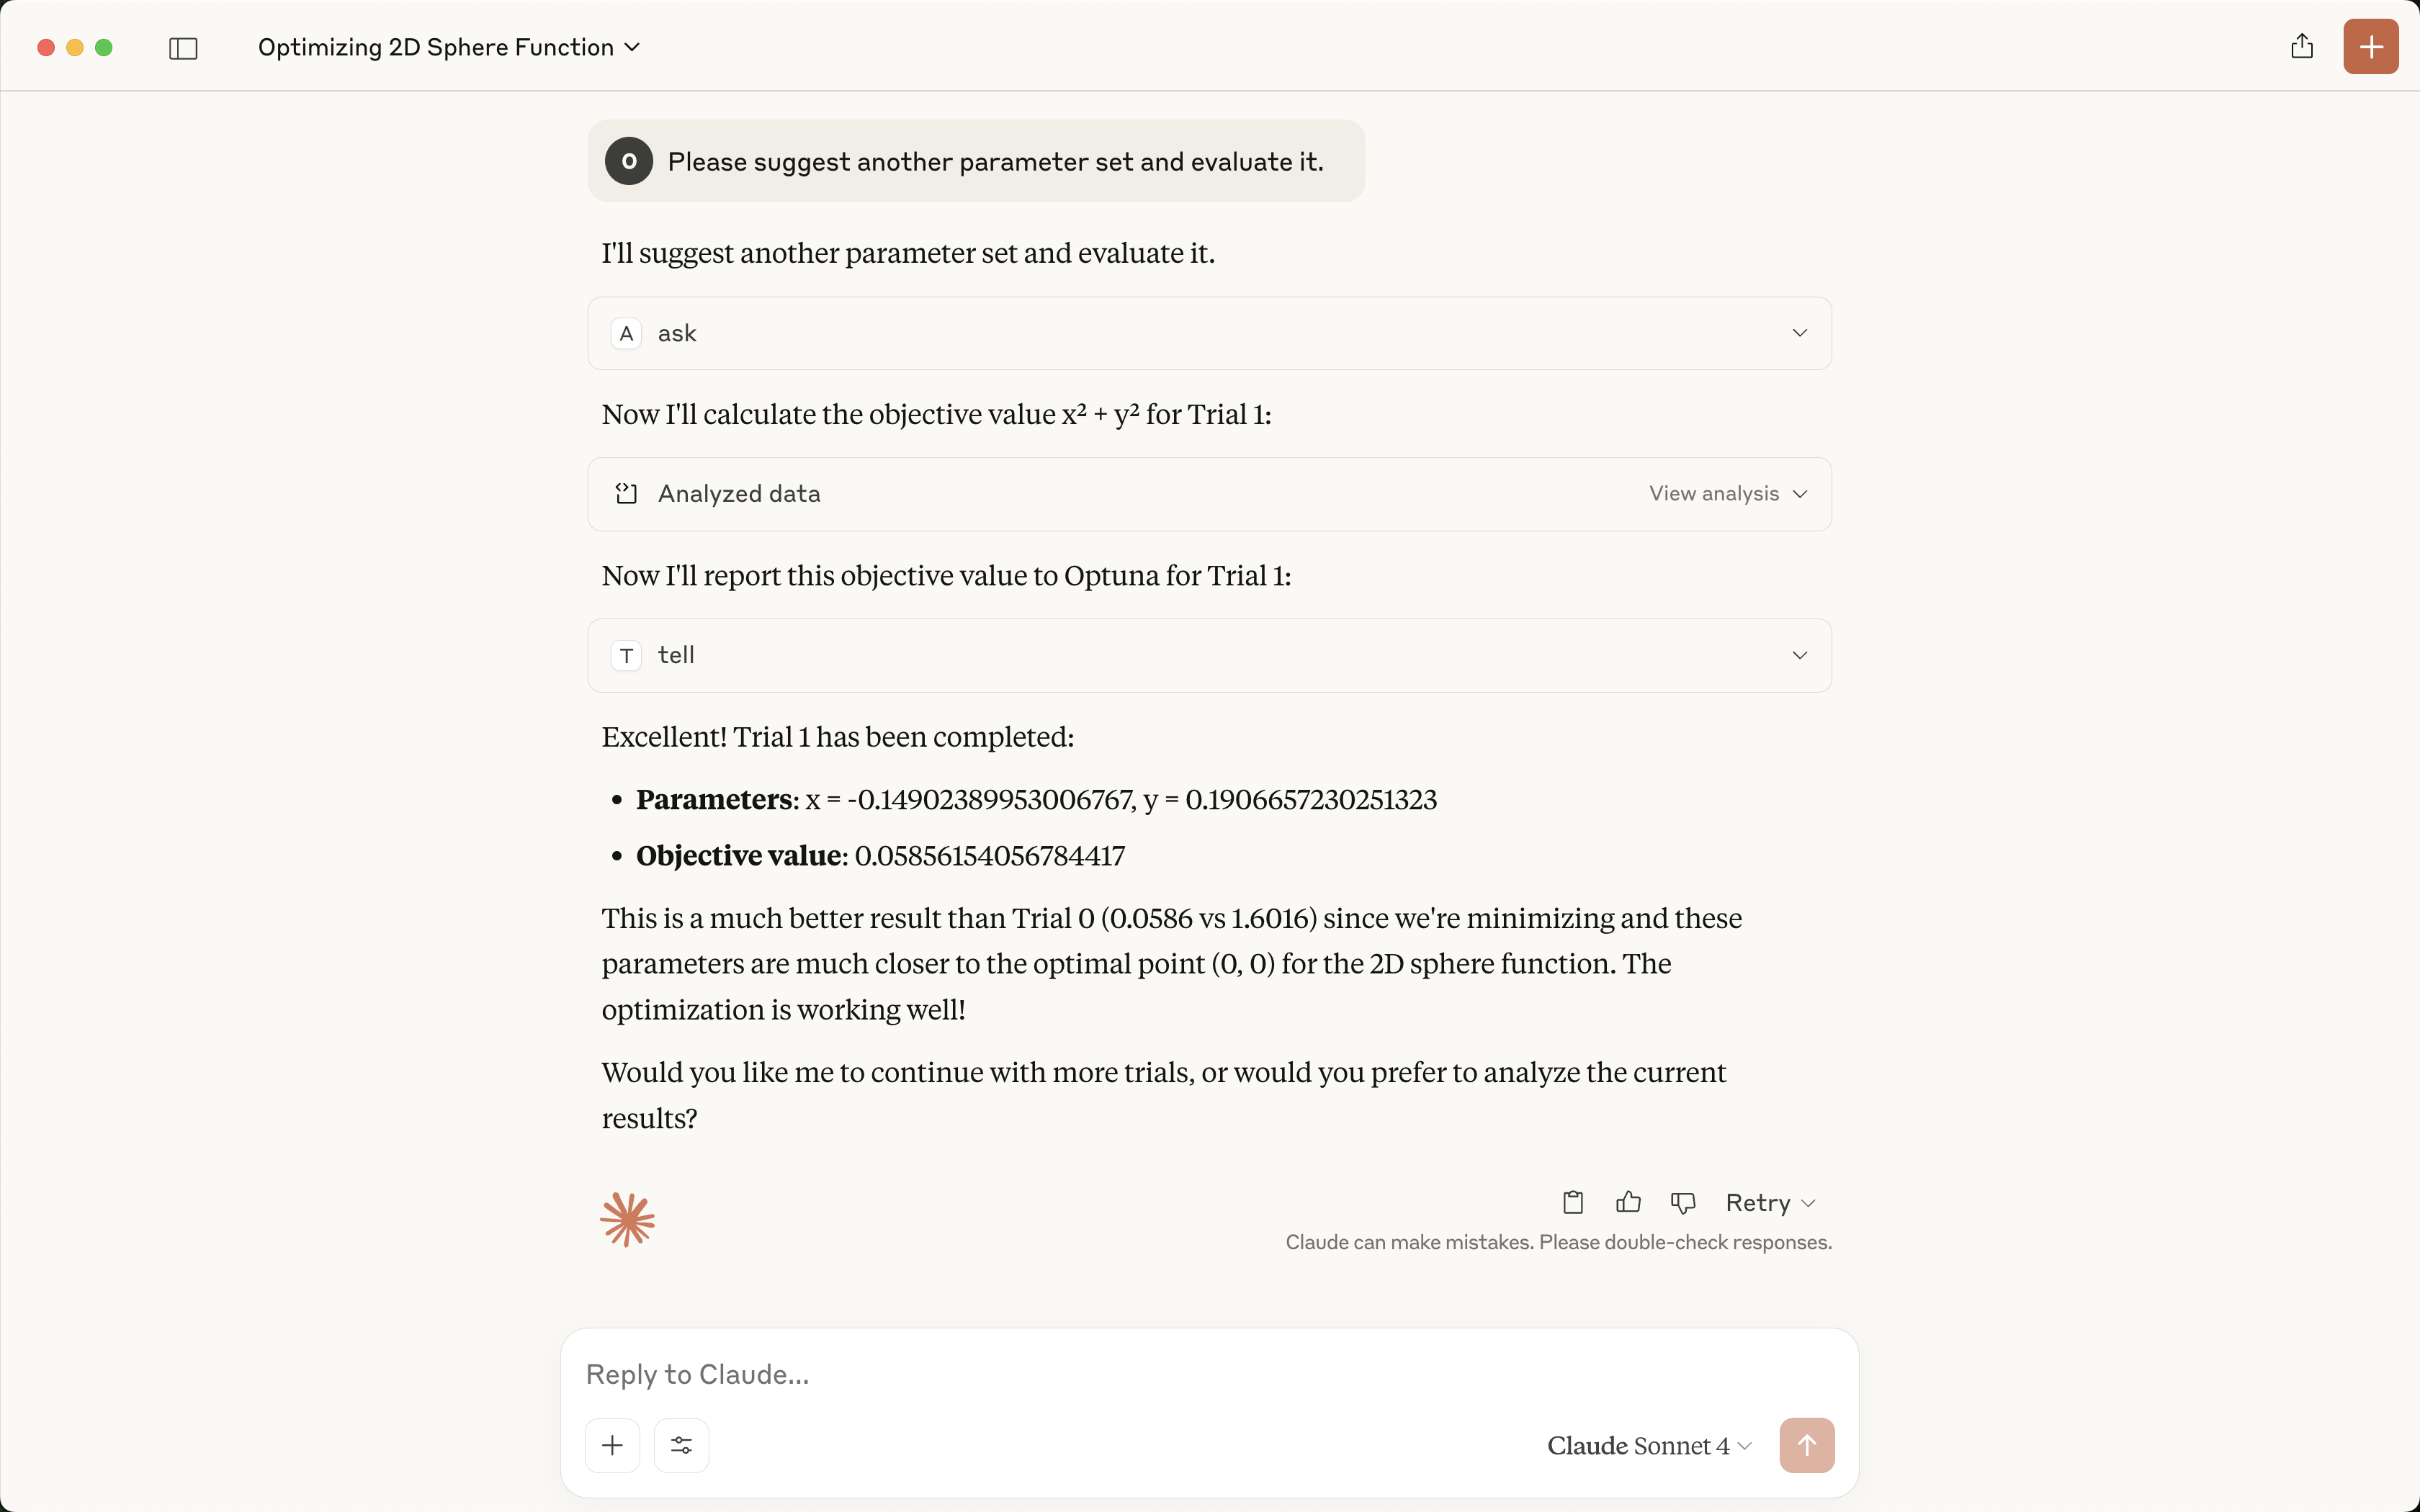 |
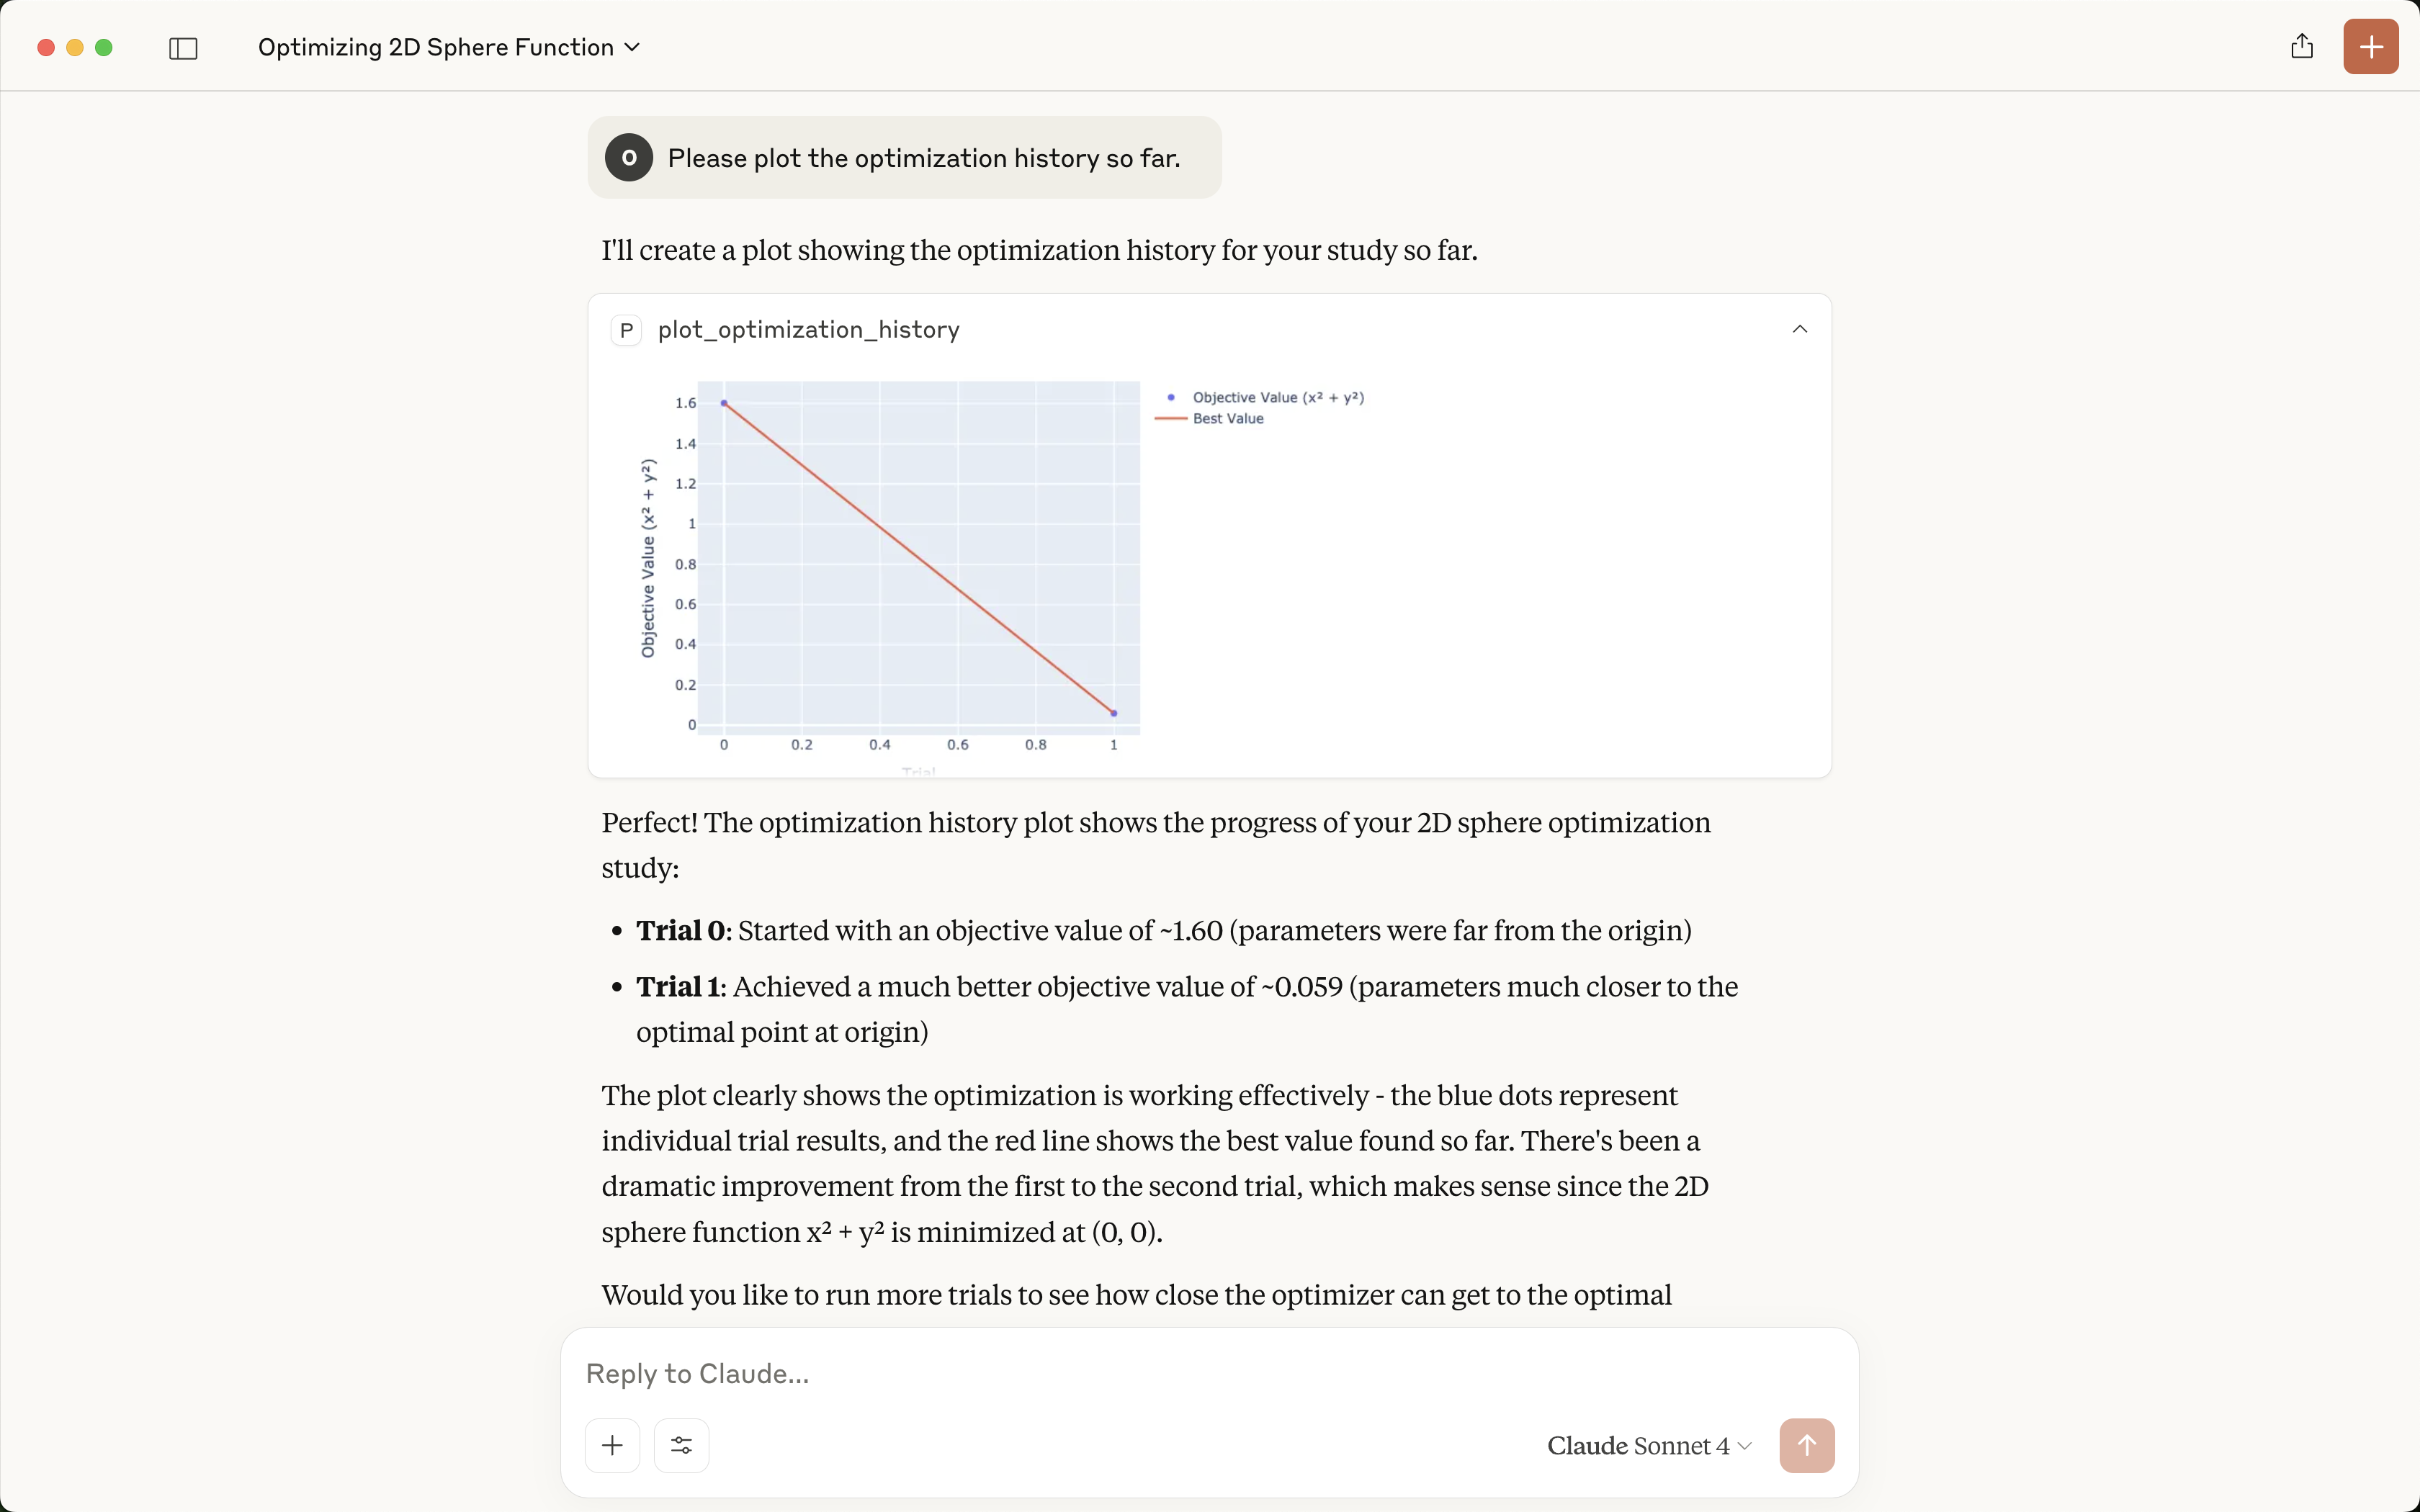
| Please plot the optimization history so far. | |
Starting the Optuna Dashboard and Analyzing Optimization Results
You can also start the Optuna dashboard via the MCP server to analyze the optimization results interactively.
| User prompt | Output in Claude |
|---|---|
| Please launch the Optuna dashboard. | 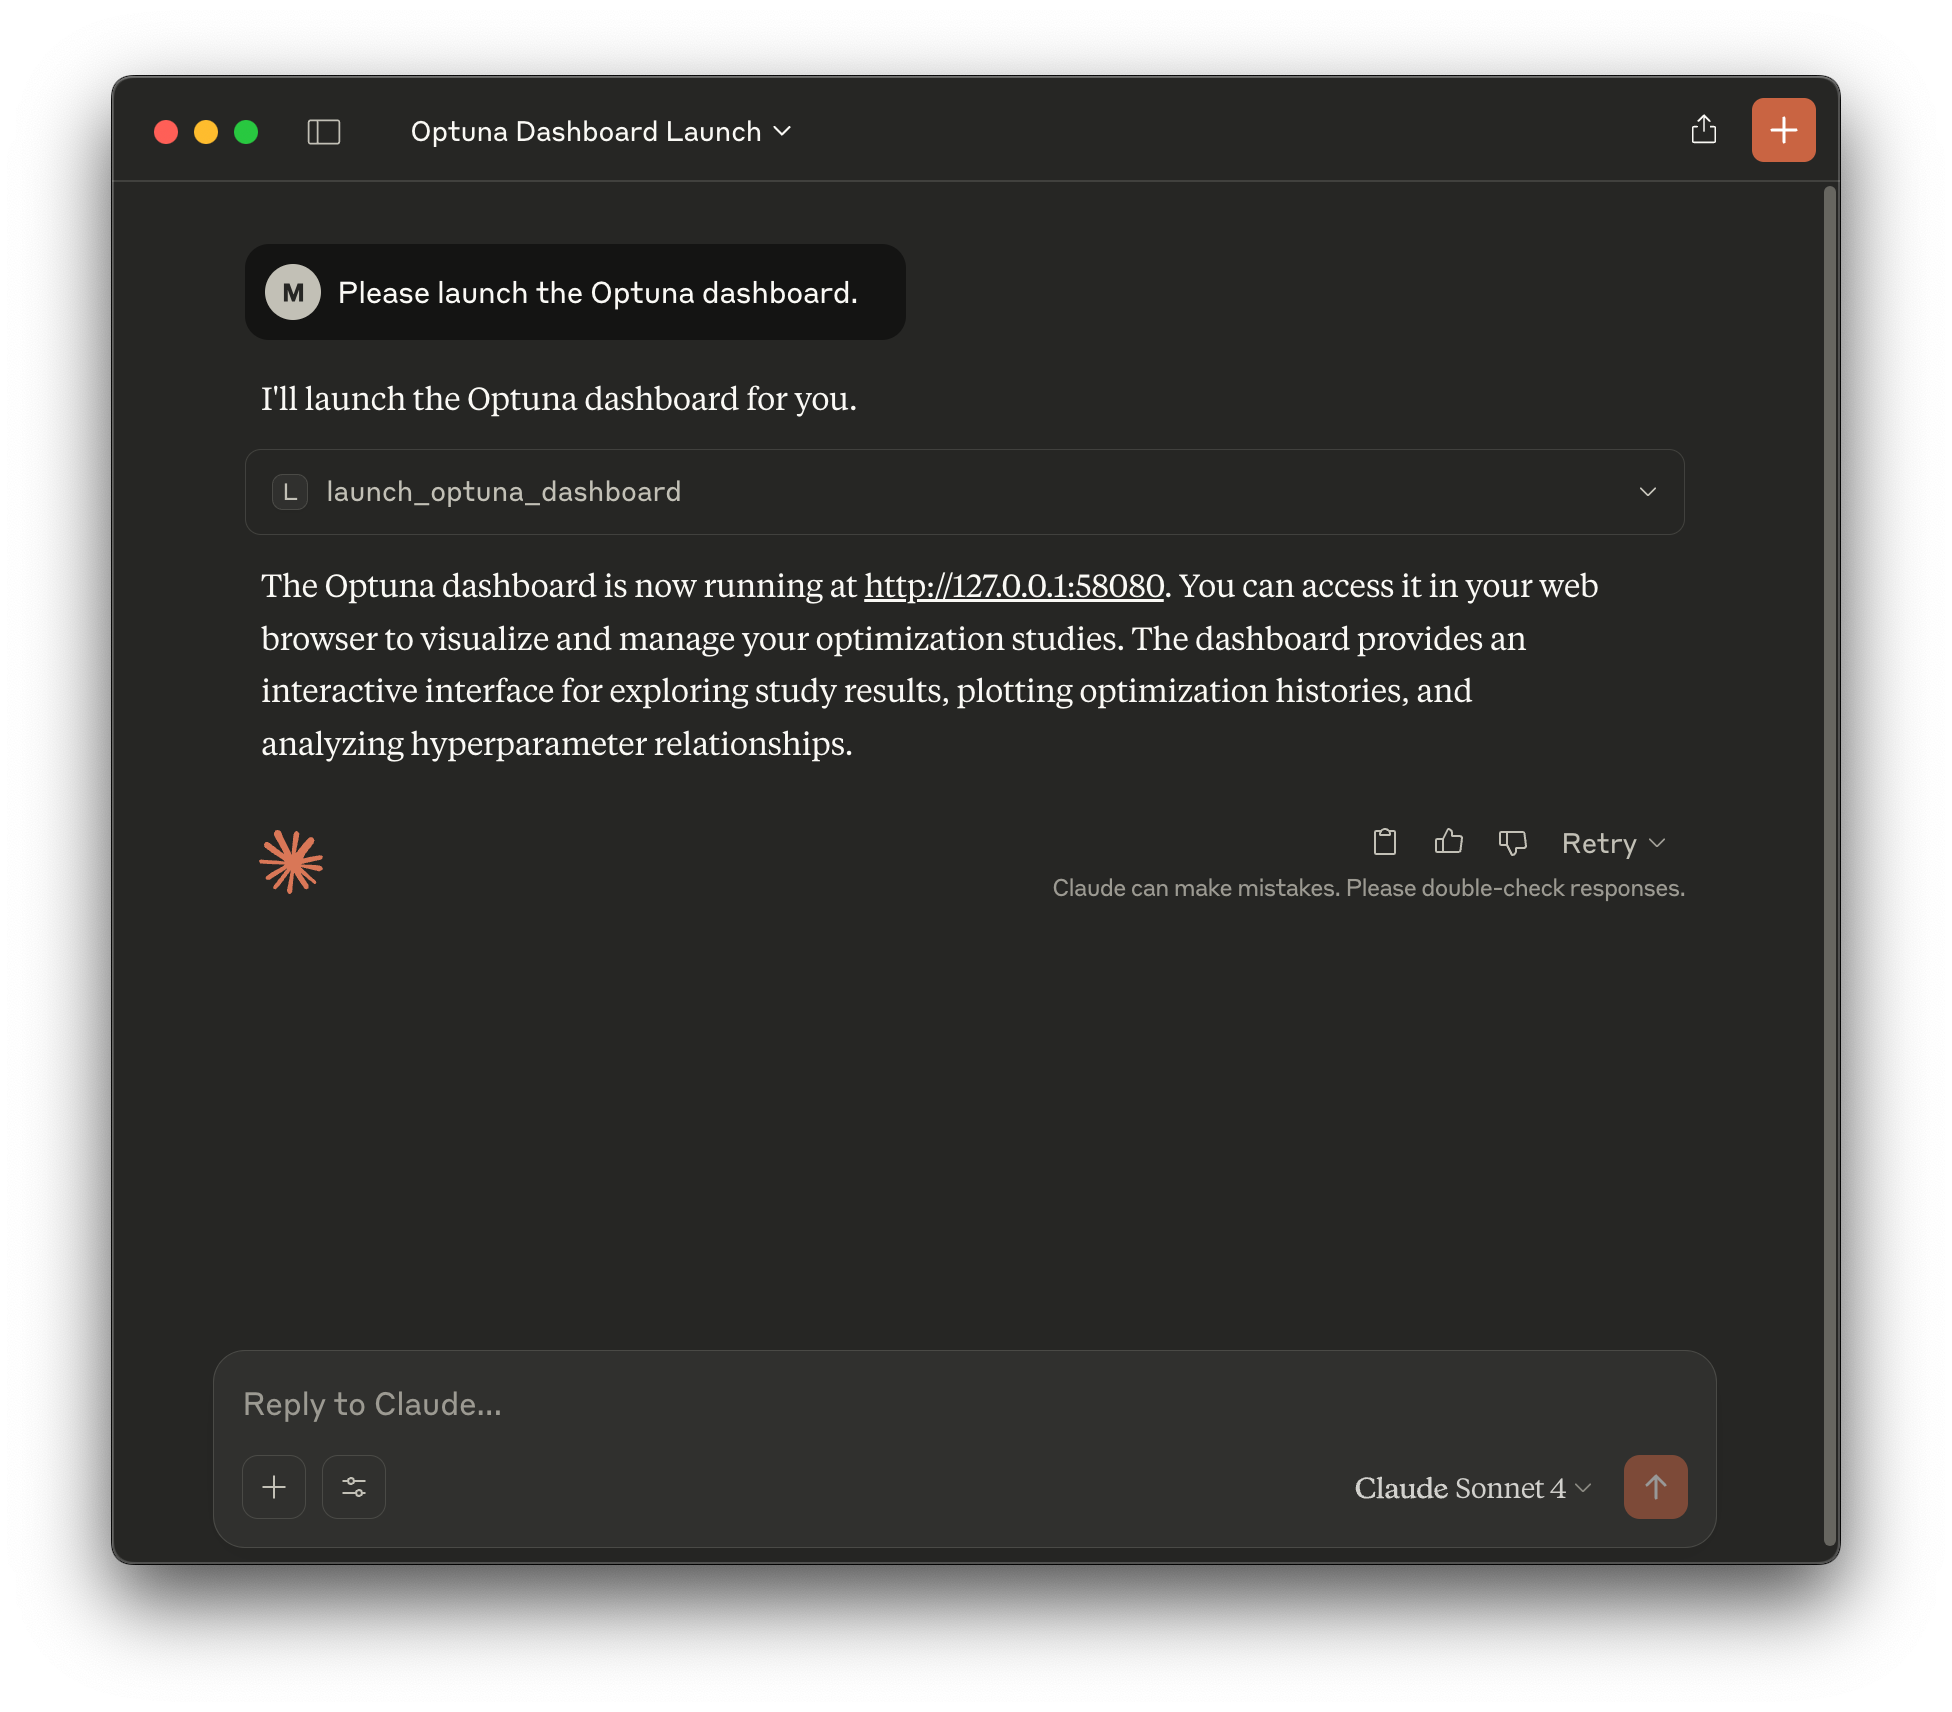 |
By default, the Optuna dashboard will be launched on port 58080. You c
README truncated. View full README on GitHub.
Alternatives
Related Skills
Browse all skillsTransform data into compelling narratives using visualization, context, and persuasive structure. Use when presenting analytics to stakeholders, creating data reports, or building executive presentations.
Analyze Google Analytics data, review website performance metrics, identify traffic patterns, and suggest data-driven improvements. Use when the user asks about analytics, website metrics, traffic analysis, conversion rates, user behavior, or performance optimization.
Advanced content and topic research skill that analyzes trends across Google Analytics, Google Trends, Substack, Medium, Reddit, LinkedIn, X, blogs, podcasts, and YouTube to generate data-driven article outlines based on user intent analysis
Expert data scientist for advanced analytics, machine learning, and statistical modeling. Handles complex data analysis, predictive modeling, and business intelligence. Use PROACTIVELY for data analysis tasks, ML modeling, statistical analysis, and data-driven insights.
YouTube Data API v3 analytics toolkit. Analyze YouTube channels, videos, and search results. Use when the user asks to: check YouTube channel stats, analyze video performance, compare channels, search for videos, get subscriber counts, view engagement metrics, find trending videos, get channel uploads, or analyze YouTube competition. Requires a YouTube Data API v3 key from Google Cloud Console.
Comprehensive backend development guide for Langfuse's Next.js 14/tRPC/Express/TypeScript monorepo. Use when creating tRPC routers, public API endpoints, BullMQ queue processors, services, or working with tRPC procedures, Next.js API routes, Prisma database access, ClickHouse analytics queries, Redis queues, OpenTelemetry instrumentation, Zod v4 validation, env.mjs configuration, tenant isolation patterns, or async patterns. Covers layered architecture (tRPC procedures → services, queue processors → services), dual database system (PostgreSQL + ClickHouse), projectId filtering for multi-tenant isolation, traceException error handling, observability patterns, and testing strategies (Jest for web, vitest for worker).